People In IT Love Stats But They Probably Won’t Love These
I’ve written a number of blogs about IT service management (ITSM) and IT service delivery many of which have expressed opinions based on observations and conversations rather than “facts.” A new Forrester report by my colleague Eveline Oehrlich has some facts to substantiate what we already knew even if we chose to ignore it.
These facts reinforce a figure that I use in most presentation to show that without exception IT professionals think that they do a better job than their business colleagues think they do. So we have this perceptions gap or perhaps we should call it a “perceptions gulf.”
The IT perceptions gulf
This is one of those pictures that really is worth a thousand words. In fact all three of these figures make it easy for me to cut short the commentary.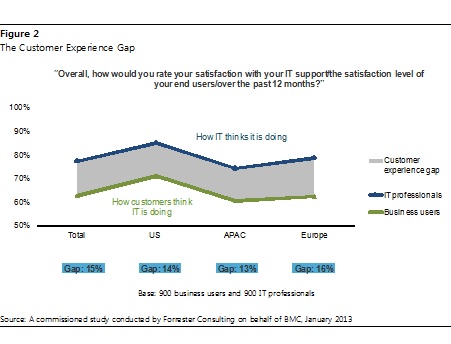
It’s interesting to see the geographical differences but, despite these, we still see a consistent gap or gulf between “How IT thinks it is doing” and “How customers think IT is doing.” Funny how our metrics aren’t a sea of red – in fact our metrics dashboard is often a sea of green.
“But that’s just perceptions” I hear you cry, “We still do a fantastic job in enabling business activities with cutting-edge IT.” But could we do better? Please read on …
Could we improve business productivity?
Ah, I could cut and paste these report figures all day – how are we impeding our business colleagues’ ability to do their jobs?
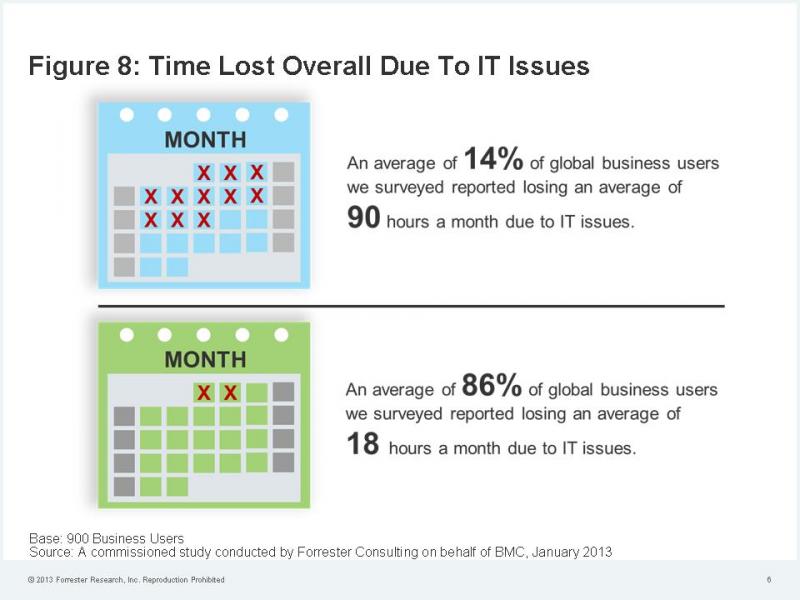
The figure says it all, I'll shush.
IT is often called a cost center – but let’s look at some scary costs
It’s a complicated figure, so if you’re like me it might be best to just look at the financials.
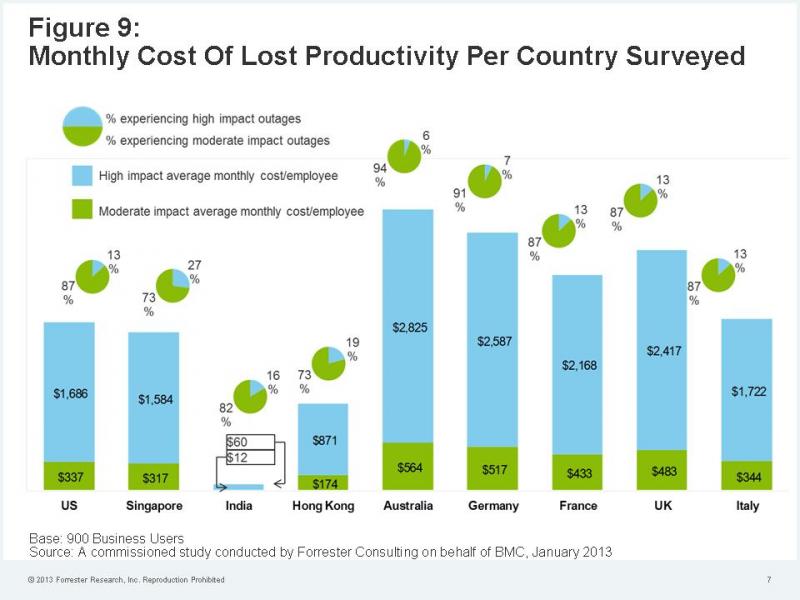
Now these are super-scary. Not the sort of figures that you want C-level executives to be pointing at and making IT investment decisions on. It sort of pushes all of the gripes around corporate “hard-to-use-ware” and IT’s unresponsiveness to changing business needs to one side. Bad IT can hurt businesses, bad IT can cost – and judging by this figure it really does.
Final thoughts
I appreciate that other surveys will offer up different stats but it doesn’t look good does it? Not in the context of outsourcing, managed services, cloud, and BYOD. I, like many, have learnt the hard way that “the grass isn’t always greener” but if we are really an aligned part of the parent organization we need to be doing whatever we can to support business success (and appreciate that we can’t talk of IT success without referencing business success). These stats are an indication that we aren’t doing enough or maybe that we are doing the wrong things; a wake-up call (yes, another one) that we need to change.
So my question to you is: Whilst you might not love these stats you need to embrace them – so what are you going to do differently if anything at all?
If I still had a real job in IT I’d certainly be seeking out the root causes of these symptoms rather than continuing to pretend that all is rosy in IT-land. As I am often heard saying: we need to measure our success at the point of IT consumption not at the point of IT creation.
If you want to read the full report it is available to download via BMC Software’s website (registration is required).
As always your thoughts and comments are encouraged.