The Data Digest: The Social Technographics Profile Of Facebook And MySpace Users (US)
Forrester's Social Technographics® looks at how consumers approach social technologies — not just the adoption of individual technologies. We group consumers into seven different categories of participation — and participation at one level may or may not overlap with participation at other levels. We use the metaphor of a ladder to show this, with the rungs at the higher end of the ladder indicating a higher level of participation. You can find more background on Social Technographics and the concept behind it at our Groundswell blog.
Overall, engagement with social activities has increased significantly in the past few years. By the end of 2009, almost three-quarters of US online adults were participating in one way or another with social media. But how do users of Facebook and MySpace compare to each other when looking at how active they are? The following graphic shows that MySpace users are far more likely to be “Creators” — the group that actually creates its own fresh content.
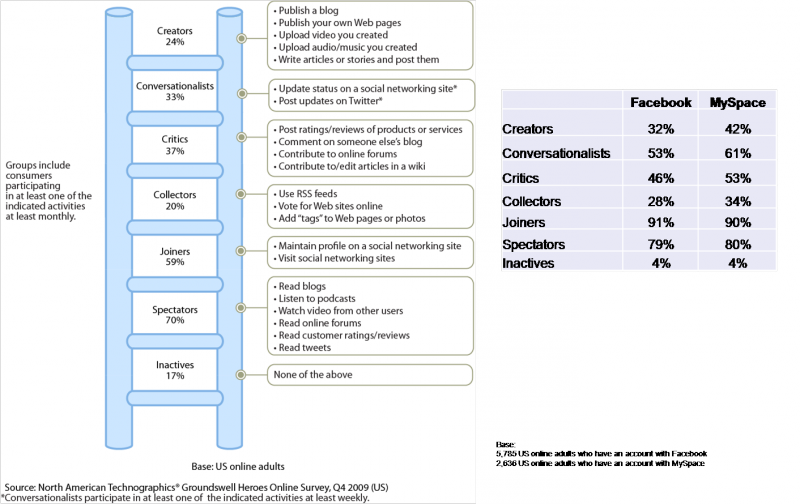
We've also asked consumers in which categories they like to express themselves online. The behaviors of Facebook and MySpace consumers are quite comparable for most categories, but MySpace users score much higher on expressing themselves on music, video, or gaming online – true to their 'Creator' profile.
Want to understand your target consumers' social behaviors? Have a play around with our online Social Technographics® Profiling tool.