Practical ITSM Advice: Defining Availability For An IT Service
As a follow up to his presentation at the 2013 itSMF Norway conference, Stuart Rance of HP has kindly donated some practical advice for those struggling with availability.
Many IT organizations define availability for IT services using a percentage (e.g. 99.999% or “five 9s”) without any clear understanding of what the number means, or how it could be measured. This often leads to dissatisfaction, with IT reporting that they have met their goals even though the customer is not satisfied.
A simple calculation of availability is based on agreed service time (AST), and downtime (DT).
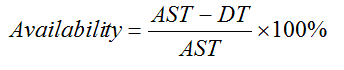
If AST is 100 hours and downtime is 2 hours then availability would be
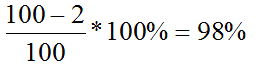
Customers are interested in their ability to use IT Services to support business processes. Availability reports will only be meaningful if they describe things the customer cares about, for example the ability to send and receive emails, or to withdraw cash from ATMs.
Number and duration of outages
A service that should be available for 100 hours and has 98% availability has 2 hours downtime. This could be a single 2 hour incident, or many shorter incidents. The relative impact of a single long incident or many shorter incidents is different for different business processes. For example, a billing run that has to be restarted and takes 2 days to complete will be seriously impacted by each outage, but the outage duration may not be important. A web-based shopping site may not be impacted by a 2 minute outage, but after 2 hours the loss of customers could be significant. Table 1 shows some examples of how an SLA might be documented to show this varying impact.
Table 1 – Outage duration and maximum frequency
| Outage duration | Maximum frequency |
|---|---|
| up to 2 minutes | 2 events per hour
5 events per day 10 events per week |
| 2 minutes to 30 minutes | 2 events per week
6 events per quarter |
| 30 minutes to 4 hours | 4 events per year |
| 4 hours to 8 hours | 1 event per year |
If we document availability like this, there are two big benefits.
- The numbers mean a lot more to the customer than simple percentage availability
- People designing infrastructure and applications have better guidance on what they need to achieve
Number of users affected
Most incidents don’t cause complete loss of service for all users. Some users may be unaffected, whilst others have no service at all. The extreme case is where a single user has a faulty client PC which prevents them making use of the service. Although we could class all of these as 100% loss of service, this would leave IT with an impossible goal, and would not be a fair measurement of availability.
The opposite extreme would be to say the service is available if any user can use it. This could lead to customer dissatisfaction if the service is unavailable for many users, whilst being reported as available!
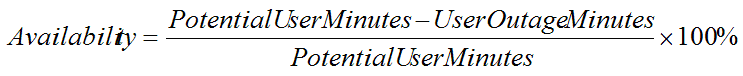
“User Outage Minutes” can be used to measure and report the impact on users. This is calculated by multiplying the number of affected users by the incident duration. This number is then compared to the potential number of user minutes of service to generate an availability figure.
In one recent engagement we calculated the availability of IP Telephony in a Call Centre in terms of Potential AgentPhoneMinutes and Lost AgentPhoneMinutes. For applications that deal with transactions or manufacturing a similar approach can be used to measure the number of lost transactions, or the extent of lost production, compared to the expected numbers.
Criticality of each business function
Most IT services support a number of business processes, some of these are critical and others are less important. For example an ATM may support cash dispensing and statement printing.
You can create a table that shows the impact on the service when each function is unavailable. Table 2 shows an example of how this might be documented.
Table 2 – Percentage degradation of service
| IT function that is not available | % degradation of service |
|---|---|
| Sending email | 100% |
| Receiving email | 100% |
| Reading public folders | 50% |
| Updating public folders | 10% |
| Accessing shared calendars | 30% |
| Updating shared calendars | 10% |
Note: Figures are not intended to add up to 100%
This table can help IT and the customer discuss and agree the relative importance of different functions, and can then be used to calculate service availability that reflects that importance.
Measurement period
It is essential to specify the time period over which measurement and reporting take place, as this can have a dramatic effect on the numbers.
Consider a service with 24*7 service and agreed availability of 99% that has an 8 hour outage:
- If we report availability every week then AST is 24 * 7 hours = 168 hours
- Measured monthly the AST is (24 * 365) / 12 = 730 hours
- Measured quarterly the AST is (24 * 365) / 4 = 2190 hours
Putting these numbers into the availability equation gives:
- Weekly availability = 100% * (168 – 8) / 168 = 95.24%.
- Monthly availability = 100% * (730 – 8) / 730 = 98.9%
- Quarterly availability = 100% * (2190 – 8) / 2190 = 99.6%
Each of these is a valid figure for the availability of the service, but only one of them shows that the target was met.
Planned downtime
One aspect of availability measurement and reporting that is often overlooked is planned downtime. Some SLAs are written so that planned downtime that occurs in a specific window is not included in availability calculations. For other customers, planned downtime that has been scheduled at least 4 weeks in advance is not counted.
Whatever choice is made the SLA must clearly define how planned downtime is to be included in calculations of availability.
Measuring availability
It is essential that the IT organization measures and reports availability in terms that can be compared to the targets. Some common approaches to measuring availability are:
- Collect data at the service desk that identifies the business impact and duration of each incident. This is often fairly inexpensive to do, but may lead to disputes about the accuracy of the data.
- Instrument all components required to deliver the service and calculate the availability based on understanding how each component contributes to the end-to-end service. This can be very effective, but may miss subtle failures, for example a minor database corruption could result in some users being unable to submit particular types of transaction.
- Use dummy clients submitting known transactions from particular points on the network to identify when the service is functioning. This does actually measure end-to-end availability (and performance), but could under-report downtime caused by subtle failures.
- Instrument applications to report end-to-end availability. This can actually measure end-to-end service availability, but the requirement must be included early in the application design.
In practice, a solution should use a combination of the above methods. This should be agreed with the customer and documented in the SLA.
My thanks to Stuart for kindly sharing his knowledge and experience.