Five Tips for Building a Better CMO Dashboard
- CMOs need relevant and timely marketing performance updates for effective decisionmaking and planning
- From the beginning, CMO dashboards should be designed with the audience and their information needs in mind
- Effective dashboards tell a logical story, as measurement results are not always intuitive or readily actionable
It’s September, and annual planning season is upon us again. CMOs are looking ahead to determine their course for the coming year – and looking back to see how well marketing performed this year. Having accurate insight into the contributions marketing made against company objectives is a vital element of the planning process. In fact, data from the 2017 CMO Study showed that improving performance measurement is one of the top five internal processes that CMOs plan to add or enhance during the next two years. When new plans are taking shape, it is the perfect time to ensure that dashboards are aligned to marketing priorities.
 However, when it comes to effective marketing performance measurement, it’s easy to get sidetracked by shiny new technologies or trendy metrics when building or updating a CMO dashboard. A better approach is to go back to the basics of successful dashboard design before adding in any bells and whistles. Here are five basic tips for building an effective CMO dashboard:
- Know your audience. Start by understanding who the dashboard is for. Is it for the CMO to share marketing performance updates to the rest of the C-suite or the board of directors? Or is it for the CMO and marketing leadership to use in managing marketing functions? Knowing the audience for the dashboard helps focus its design, clarify the class and type of metrics to select, and determine the dimensional filters (e.g. industry, geography, product, campaign) that are required. In many organizations, a single dashboard is not sufficient, so it’s not uncommon for CMOs to have two dashboards. One dashboard may be business-facing to share marketing’s contribution to creating business value to an audience of executive business leadership and senior marketing leaders, while a second is the authoritative tool for managing departmental marketing results. Avoid building a dashboard that tries to be all things to all audiences.
- Understand audience business questions. Understand what business questions the audience has, how these questions can be answered with dashboard data, and how frequently the information needs to be updated to stay relevant. This is a critical step, as it forces the dashboard to align with high-level marketing goals and business objectives, rather than become home to a set of vanity metrics. CMOs frequently need answers to key questions. What is marketing’s contribution to pipeline/bookings/revenue? How have our campaigns performed? What is the impact of our branding efforts? What is our program ROI? Spending time upfront with the CMO to determine the business questions that need to answered goes a long way toward making the dashboard impactful and useful in driving decisionmaking.
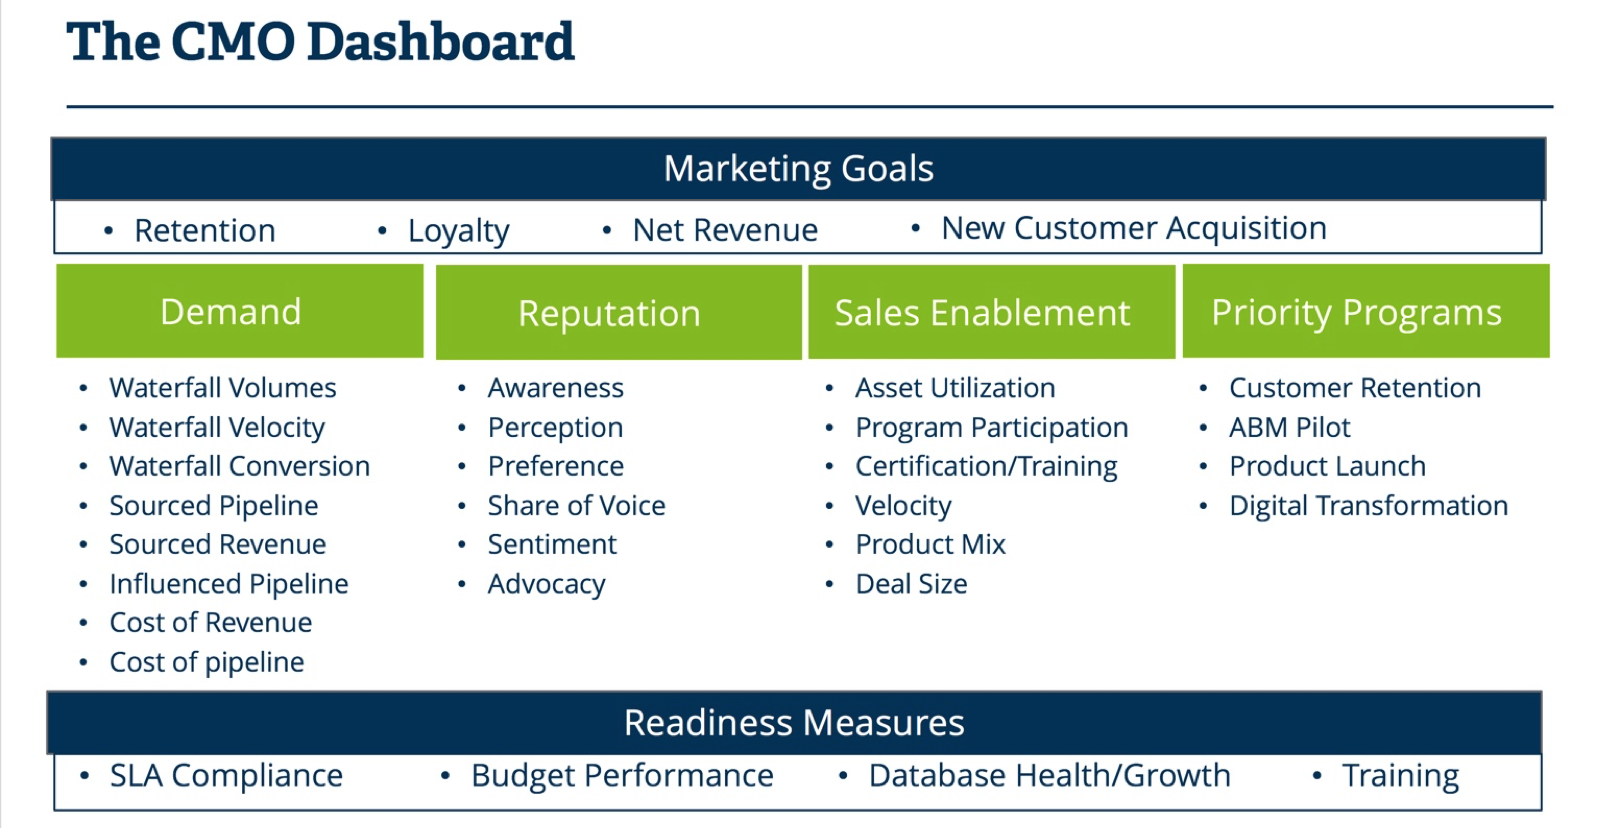
- Tell a story. Dashboards need to tell a story, as measurement results and data points are not always intuitive or readily actionable to the intended audience. Use a logical presentation flow, as the most compelling view of marketing performance begins with the big picture, then connects with the actions marketing takes, and links to supporting data. A best practice is to headline the dashboard with an executive summary of performance against high-level goals, then illustrate marketing performance against strategic campaigns, as well as out-of-campaign demand creation, brand/reputation and sales/partner enablement programs. The dashboard should also be used to highlight performance against priority programs (e.g. major product launches, proprietary events, technology implementation projects) and key readiness measures (e.g. service-level agreement compliance, database health/growth, staff training, budget performance). Make sure that the dashboard story addresses all audience questions and does not focus solely on demand metrics.
- Use visualization effectively. We know that a picture equals a thousand words – and this is certainly true for CMO dashboards. To ensure the audience grasps the information quickly, the most important performance metrics should be prominently displayed and/or receive the boldest graphic treatment to attract attention. All graphics and charts must be clearly labeled. Use intuitive performance indicators (e.g. arrows, stoplights, color coding) to make it easy for the audience to interpret results. Put data in context and show performance relative to goals, trends and external benchmarks whenever possible. Consider adding complementary bullet points, footnotes or captions with hyperlinks to drill-down data to cite potential reasons for performance improvements or declines.
- Weave in analysis and share insights. Data shifts and performance results changes may not be obvious to the dashboard audience. This is why the last step of adding analysis and insights is critical. The dashboard should include space for commentary to explain shifts in direction and analysis of why the data stands where it does. Correlate changes in trend lines to significant company activity. Look for relationships between data points that can be logically combined or contrasted. Also, note what has been planned to fix problem areas. SiriusDecisions recommends summarizing key takeaways on a concluding page to build on your story behind why performance issues exist and how they will be addressed going forward.
A good CMO dashboard is not necessarily built from the latest business intelligence software or has the flashiest animated graphics. Effective dashboards answer executive questions about marketing performance, tell a logical story, convey priority, simplify comparisons, and avoid data and reporting overload. They provide the CMO with the data needed to make good decisions, course correct, and improve planning and forecasting for the coming year.