Go Beyond Surveys In CX: Learn From Two Practitioners’ Experiences
At Forrester’s CX North America event, I delivered a session about going beyond surveys to measure customer experience (CX). To help convince attendees it’s possible, I asked two wonderful guest speakers to highlight their organization’s efforts to move beyond surveys in CX:
- TS Balaji, vice president of experience design and customer experience at Cox Communications
- Jhumur Choudhury, research lead, advisory services (for business and wealth customers) at ATB Financial
We Are At Peak Survey Effectiveness In CX
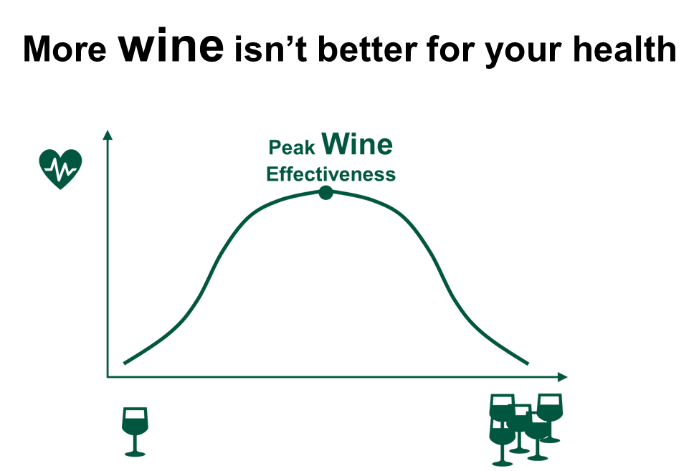
Peak survey effectiveness is what I call the point where each additional survey has a smaller positive effect on CX success and eventually affects CX success negatively!
It’s just like with wine: One glass a day is supposed to be healthy. But drink more than a certain number (how high that number is depends on you 😉), and your health will suffer. Being at or past peak wine effectiveness means you need new habits.
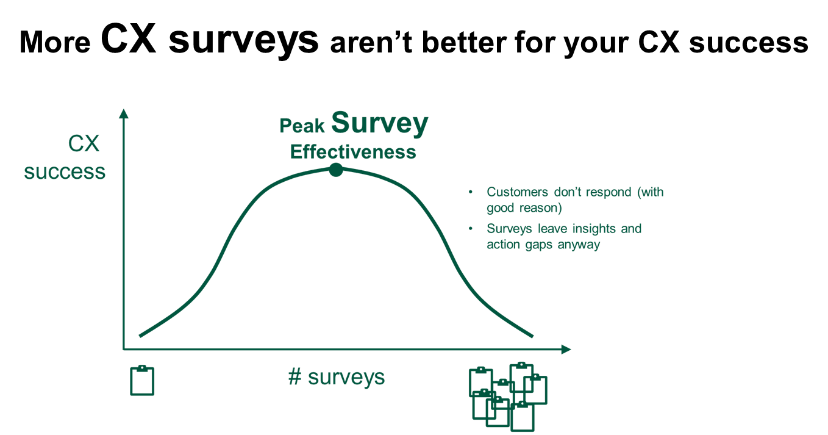
Being at peak survey effectiveness means you also need new habits. To help attendees, I focused the session on two ends of the spectrum: transactional and relational CX measurement. We received a lot of questions from attendees during the session, and Jhumur and TS were kind enough to respond afterward so I could share them with you. We hope these insights will be valuable.
Beyond Transactional Surveys: Create A Phased Plan That Drives Success And Stakeholder Engagement
TS Balaji walked attendees through why Cox knew it needed to move beyond transactional surveys and shared where Cox is in its three-phase approach to move to sentiment as a metric for its contact centers. Below are his responses to attendee questions:
Q: What tools do you use for analyzing unstructured data?
TS: We use NICE/Nexidia to analyze sentiment of calls. We also do some analysis of unstructured data using our survey vendor — Medallia — and our vendor for digital feedback — ForeSee.
Q: How do you analyze your calls? Are you doing anything beyond sentiment at this point, such as text analytics?
TS: We have a whole program adjacent to the sentiment scoring. We can do things like text analytics in addition to other types of analysis.
Q: What other qualitative or subjective data did you collect to strengthen the signal you got from call sentiment analysis?
TS: We currently have NPS [Net Promoter Score] surveys, so we wanted to understand the connection/correlation between NPS and sentiment. That was the first piece of work that was done. Then we are actively listening to calls and having our quality folks listen to them as well to understand the qualitative nature to make sure the scoring works well for the different groups.
Q: Does the sentiment score include scores for multiple measures that you combine into a single score or just a single score for the call overall?
TS: Good question. If you are trying to implement sentiment or any measure for that matter, I would ask why — what are we trying to drive with the score? As you pointed out, a single score would be a composite of different behaviors. Now the question would be, can that single score drive the results that you are hoping to achieve? A lot of my team’s time is being spent on this to think about it from different angles. Imagine a score that’s an average; it’s highly likely that an average doesn’t move much in days/weeks/months. You could use an average as a measure if you just want to understand huge swings in the environment. Or you could take the same measure and focus on an industry vertical and say, how does my score compare to my peers in the same industry? That drives a different type of behavior. So we have and are putting in a lot of thought around this measure. I would say this would need to be customized to the environment where you are applying this measure.
Q: How long did the pilot and trial go?
TS: The pilot was a few weeks with a small group of managers. The trial is going to go on for a couple of months and will move into production as a continuation.
Q: End to end, how long is your three-phase plan?
TS: The pilot, trial, and launch is the first phase of the modernization of the experience measurement program. This phase of the work will be closing on its one-year anniversary in Q4 of this year. I anticipate that the associated change management will be large and will help me assess other parts of my plan.
Beyond Relationship Surveys: Shorten And Augment Relationship Surveys And Increase Response Rates In The Process
Jhumur Choudhury shared how she radically shortened relationship surveys at ATB and augments them with information from qualitative research, frontline inputs, observations, and syndicated research. Below are her responses to attendee questions:
Q: You said that you shortened your relationship survey and saw a big response rate increase. Can you share what results you saw?
Jhumur: After we shortened the 18-minute relational survey to less than a 5-minute survey, the response rate increased from 15% to about 45%.
Q: What interactions trigger your transactional surveys?
Jhumur: The customer feedback (especially the open-ended comments) in the relational survey is constantly analyzed to understand if there are gaps in particular services or products or touchpoints that are not meeting customer needs. The initial interactions/touchpoints selected in the transactional surveys were based on the pain points identified in the relational survey. At the transactional level, the feedback is directly actionable to improve the product/service. We continue to monitor relational survey feedback on an annual basis to gauge the need for a new transactional survey trigger or phasing out an existing one.
Q: What are your response rates for each survey type?
Jhumur: With a shortened relational survey, we increased the response rate from 15% to 45%. The response rates for transactional surveys varied across touchpoints and were somewhere between 25% and 55%.
Q: How are the open-ended comments analyzed? Are you using a text analytics tool or any special process?
Jhumur: We use a natural language processing [NLP] tool built in-house by our data scientists. The tool has been “trained” based on several years of open-ended customer feedback. We also use Qualtrics Text iQ. The initial themes are identified using NLP. However, the researchers in our team ensure that they go through as many comments as possible to really understand the customer voice and integrate the story in our reporting.
We also cross-tab open-ended comments by several closed-ended questions, like what promoters are saying vs. detractors, is the sentiment different among clients in a particular industry, and revenue bucket. Cross-tabbing open-ended comments by closed-ended questions helps us add the “so what” and explain scores better.
Q: How did you close the customer loop? Can you provide examples?
Jhumur: We add a “close the loop” question at the end of every survey, asking customers if they want someone from ATB to get in touch with them. For closing the loop with relational surveys, we compile the responses on a weekly basis and send it to relevant business stakeholders to enter into our CRM [customer relationship management system] and make sure that a frontline team member actions it within 48/72 hours of entering it in the system; failing that, it gets escalated to their manager.
For transactional surveys, every time we receive a request to close the loop, it auto-sends an email from the survey system to a stakeholder responsible for the product/service to take action within 24 hours.
Q: Did you promote this refreshed approach with clients to drive higher response?
Jhumur: We did not proactively promote the revised approach to clients. However, after we sent them a less-than-5-minute relational survey, some of our biggest capital market business clients proactively reached out to our executive vice president in that space to comment about the user friendliness of the survey and the chance to give open-ended comments instead of trying to rate products/services on a five-point scale. Also, in this space, we supplemented relational survey feedback with in-depth customer interviews, which was also very positively received by our high-value business customers. It made them feel that ATB really cares about them and their needs because someone other than their banker is reaching out to them to really understand their needs and business.
Q: Has that shift dramatically increased the resources needed to conduct surveys?
Jhumur: Our relational surveys are hosted by external vendors. Shortening surveys has led us to rely less on vendor-generated reports and helped us reach some cost-efficiency there. Also, since we are relying on syndicated studies for hard-to-reach audiences like the ag [agriculture] space, we are freeing up resources there, as well. What I would say is that this shift has led to a change in mindset and work roles among our internal research team. Instead of managing vendors, our internal research team functions as consultants trying to get the business teams the insights they need to make informed decisions. I also encourage the team to focus on open-ended customer feedback to really internalize the customer voice. The focus is on how to leverage existing data to generate the most actionable insights versus focusing on research methodologies and traditional market research reports.
Q: How does a company’s organizational structure influence whether this approach can be done? What are your assumptions about where these activities are coordinated and interpreted?
Jhumur: Sensing and scanning to understand the customer and have customer problems define business problems is critical for the success of any VoC [voice-of-the-customer] program. And we all know executive sponsorship is key. At ATB, we are lucky to have a chief experience officer who sits in the executive leadership team. Since our research team reports up to the chief experience officer, we always put in the effort to have the customer pain points and needs and inform our business processes. We are not a research team in isolation responsible only for metrics; we partner with our business team members every step of the project, right from project initiation, conception to execution and ongoing tracking. I would say having support teams like research, marketing, journey mapping, and measuring as part of the experience office helps us reach out to business in a coordinated way.
Q: If and how did you incorporate UX [user experience] research methods and/or collaborate with a UX research team?
Jhumur: Our research team at ATB is composed of both UX and CX researchers. As we are refreshing our mobile and online platform, we have dedicated UX researchers who work with the product managers to do regular UX testing as new features are being built. We also have intercepts on our digital platforms, which helps us keep track of standard UX metrics. However, we also make sure any feedback we receive about our digital platforms from our ongoing relational and transactional research is themed and used as the starting point for the need for a new feature. We also make sure we track if a particular type of complaint has gone down in our relational or transactional survey because a new feature has been added to the online platform based on customer feedback. We tend to build “hybrid researchers” at ATB who use both their UX and CX skill to give insights to generate great customer experiences.